- NEED HELP? CALL US NOW
- +919995411505
- [email protected]
BIOSTATISTICS PART 2
Normal Distribution
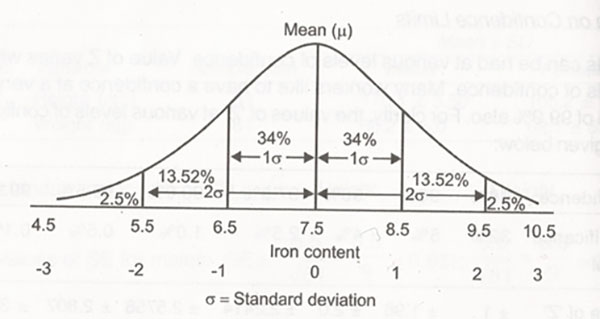
- Bell shaped curve
- In normal distribution curve, Mean=Mode=Median
- Standard deviation = 1
- The shape of normal distribution depends on mean, standard deviation and the number and nature of observation.
- Total area of this bell–shaped curve =1
- Confidence interval =Mean ± Standard error
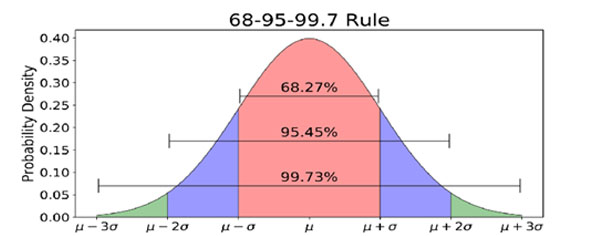
- 68.27% CI = Mean ± S.E
- 95.45% CI = Mean ± 2 S.E
- 99.73% CI = Mean ± 3 S.E
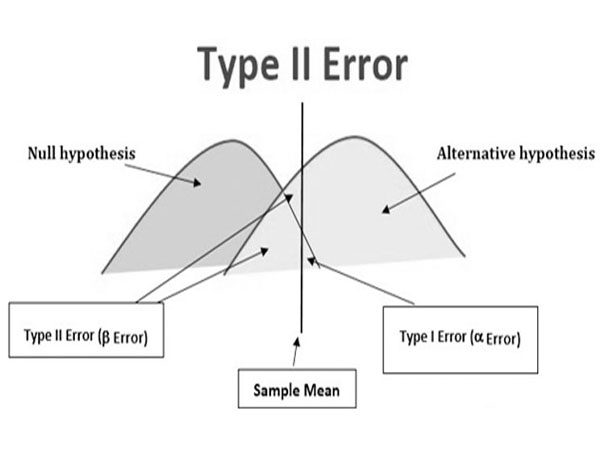
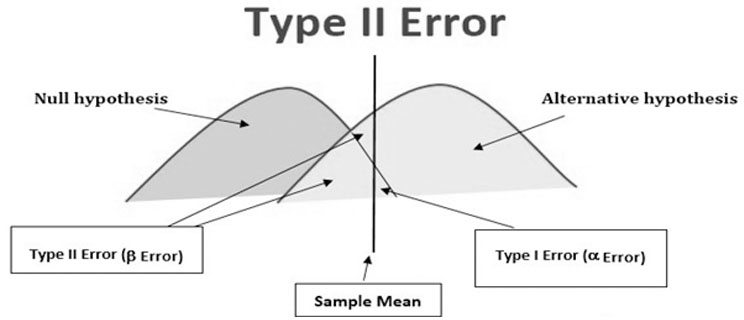
Type of Errors
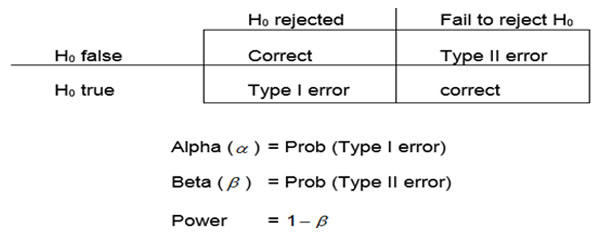
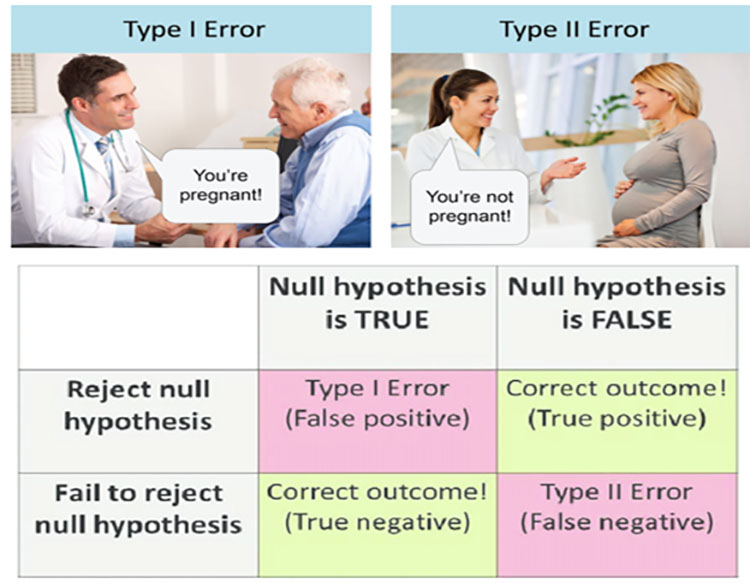
>Type I Error (α): - the probability that difference shown occurred due to chance
It is known as level of significance / critical region / region of rejection
P [reject H0 when it is true]
>Type II Error (β): - if a true difference of a stated magnitude existed but the study would not have picked up as statistically significant.
P [accept HA when it is false]
>Power of Study (1 – β): - the probability that if a true difference of stated magnitude existed then the study would have picked up as statistically significant.
Test of Hypothesis
- Fix Null Hypothesis: there is no difference / relation between the groups
- Fix Alternative Hypothesis : there is significant difference / relation between the groups
- Level of Significance (α)
- Test of Significance (ex) Z = | x1 – x2 | / SE (x1 – x2)
- If |Z|> Zα - if the computed value of test statistic is greater than the critical or significance value then we say that it is significant and the null hypothesis is rejected at level of significance α.
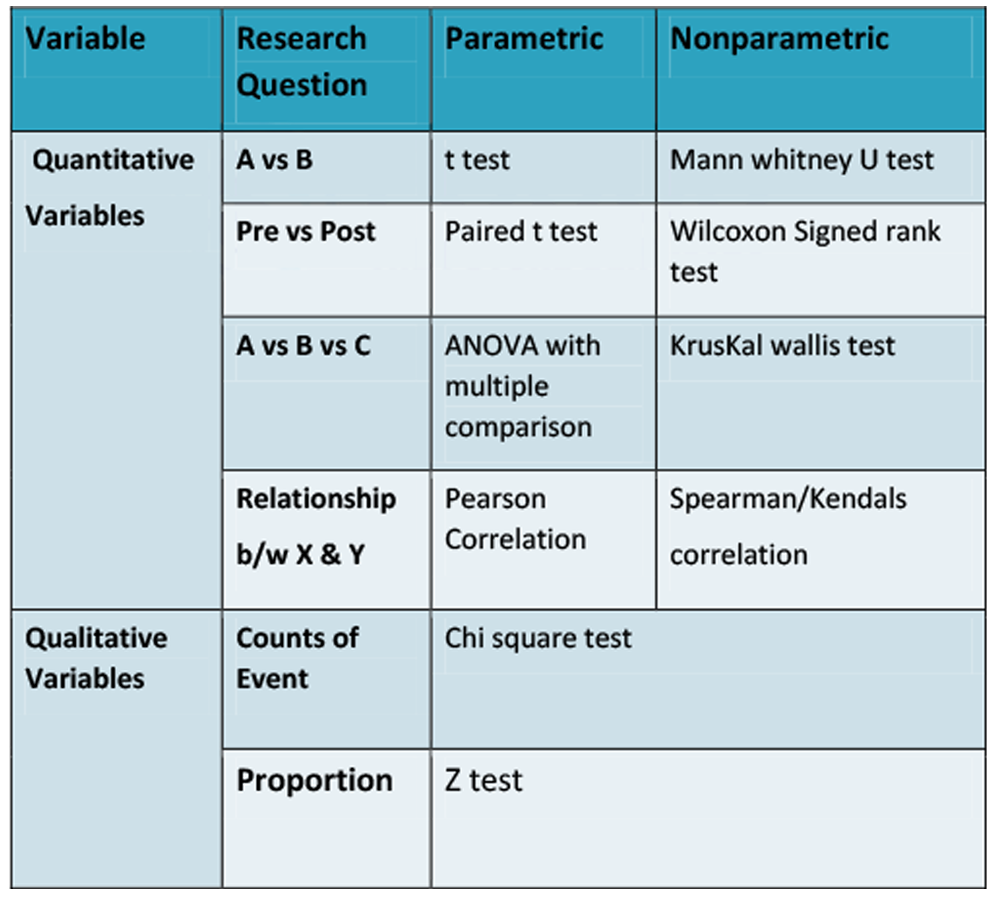
Test of Significance
Parametric Tests: -
- Mean and SD as Parameters
- Large Sample Size
- Followed Normal Distribution
Nonparametric Tests: -
- Followed not normal distribution
- Small sample size
- Use median / ranks
Parametric Tests: -
Paired t test- Calculate the difference in each set of paired observation.
- Same people are sampled on 2 different occasions.(ex: glucose test before and after)
Unpaired / Independent t Test
Two groups of subjects are sampled in 1 occasion. (Ex: nutritional study (1 occasion) total 25 candidates are there, 13 are provided with normal diet vitamin supplements and 12 are provided with normal diet)Correlation
- To find out if there is any correlation between the two variables under study.
- Karl pearson a British biometrician developed a formula for correlation.
- Correlation coefficient between two random variables X and Y usually denoted by r(X,Y) = Cov (X,Y) / xy
- X – Independent Variable, Y – Dependent Variable
- Its value ranges from -1 to +1
Regression Techniques
- The linear Regression Model: Y = a + b X ,
- Where Y is Dependent Variable, X is Independent variable
- b is Slope
- a = Y – b * X
- a = intercept for which X = 0
- The slope b will explain that for each unit change in x, y increase.
Non Parametric Tests
- U test : - test difference in ranks score of two different groups
- Wilcoxon Signed rank test: - within difference in ranks of two related groups
- Median Test:- To test difference b/w medians of two different groups
- Kruskal Wallis Test: - Difference in ranks of three or more independent groups
- Chi square test:- find difference b/w 2 categorical data
MCQS
1. In a 3 ×3 table, the no of degrees of freedom is
a) 4b) 9
c) 3
d) 81
Answer: A
Degree of Freedom = (R – 1) * (C – 1)
2. In a study, variation in cholesterol was seen before and after giving a drug. The test which would give its significance
a) Unpaired testb) Paired test
c) Chi square test
d) Fishers test
Answer: b
A paired t-test is used to compare two population means where you have two samples in which observations in one sample can be paired with observations in the other sample.
3. A Gaussian distribution is
a) Normal distributionb) Log normal distribution
c) Poisson distribution
d) Variant distribution
Answer: A
A random variable with a Gaussian distribution is said to be normally distributed
Related posts

April 10, 2025

April 9, 2025

April 4, 2025
