- NEED HELP? CALL US NOW
- +919995411505
- [email protected]
Biostatistics Part 1 NEET MDS
- It is the method of collection, organizing, analyzing, tabulating & interpretation of data related to biological science
- Data: A collective recording of observations either numerical or non numerical
- 2 types
Quantitative
DiscreteContinuous
Qualitative
CategoricalAttributes or qualities
| Quantitative Data / Numerical Data | ||
| Discrete | Continuous | |
| Definition |
|
|
| Example |
|
|
| Scales of measurement | Definition | Example |
| Nominal Scale |
|
|
| Ordinal Scale |
|
|
| Interval Scale |
|
|
| Ratio Scale |
|
|
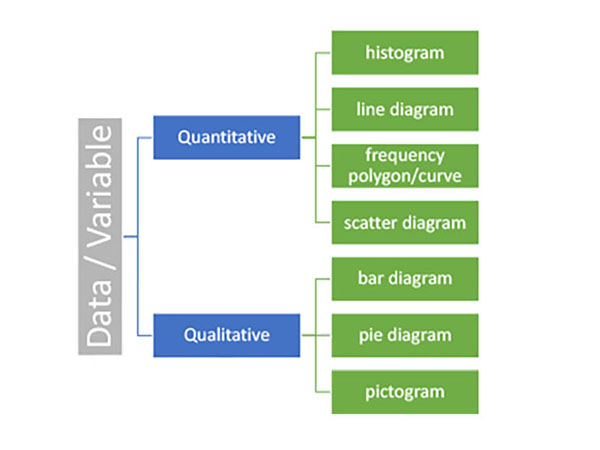
Graphical representation of data

| Variable | Table | To Represent.. |
| Quantitative variables | Simple Table | Descriptive Stats |
| Qualitative variables | Simple Table Contingency Table | Descriptive Stats Association |
| Variable | Graph | To Represent. |
| Quantitative Variables | Frequency Curve | To check normality |
| Line Diagram | To compare groups | |
| Scatter Diagram |
|
|
| Qualitative Variables | Bar Diagram | To compare groups (with numbers) |
| Pictogram |
|
|
| Pie Diagram | To compare frequency | |
| Spatial Data | Map Diagram | To compare Prevalence / Incidence / Deaths |
Descriptive Statistics

MCQS
1. Ranking students from the individuals which the highest grade – point average to the lowest is an example of a
a) Ordinal scaleb) Nominal Scale
c) Interval scale
d) Ratio scale
2. When variables are not measured, which of the following is used to be represented?
a) Variationb) Ordinal
c) Nominal
d) Ratio
3. Which of the following is not a measure of central tendency
a) Meanb) Mode
c) Range
d) median