- NEED HELP? CALL US NOW
- +919995411505
- [email protected]
Biostatistics Part 1 QA

Biostatistics Part 1
1. The graphic representation of frequency distribution with X and Y axis is
a) Frequency polygonb) Histogram
c) Pictogram
d) Pie diagram
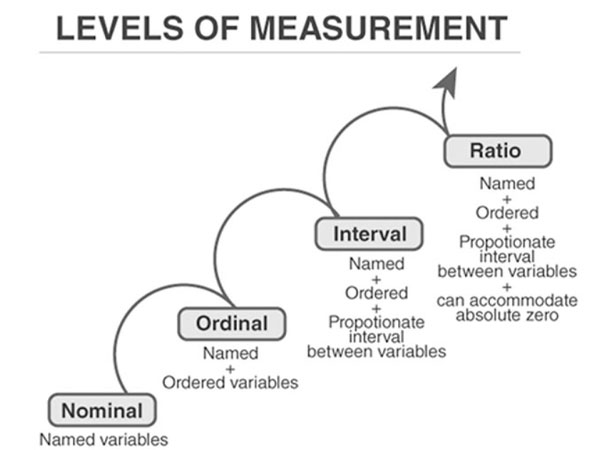
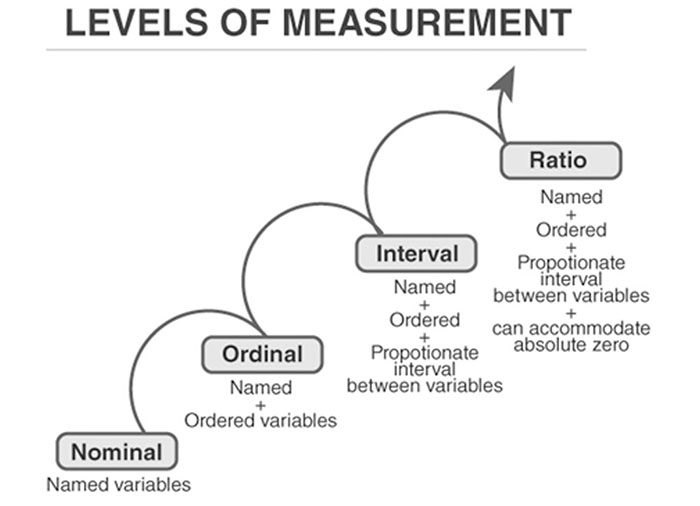
2. Observations that are not only different from category to category but can be ranked according to some criterion, they are said to be measured as
a) Ordinal scaleb) Nominal scale
c) Interval scale
d) None of the above
3. Histogram is a
a) Pie diagramb) Bar diagram
c) Frequency polygon
d) Line diagram
4. Find range: 10,20,40,60,100.
(a) 30(b) 40
(c) 80
(d) 90
5. Data that can only be categorized under different categories and frequencies which cannot be expressed in number and not measurable is
a) Qualitative datab) Quantitative data
c) Continuous variable
d) None of the above
ANSWERS AND DESCRIPTION
1. B
Histogram is a bar diagram without gap between the bars.it is used to depict quantitative data of continuous type. On the x-axis, the size of an observation is marked. On the Y axis is the frequencies are marked.2. A

3. B
Histogram is a graphical display of data using bars of different heights.4. D
Range = Difference between two extreme values.(100-10= 90)
5. A

Related posts
April 10, 2025
April 9, 2025
April 4, 2025


